Contents of page >
- 1) use mongostat command -
- 2) Understanding mongostat - What does Mongostat command do >
- 3) For more highly detailed MongoDB statistics you may run db.serverStatus() >
Please ensure mongod (mongoDB server) is running before executing the follow up commands to find mongoDB statistics.
1) use mongostat command -
Go to bin directory of MongoDB
And type mongostat.
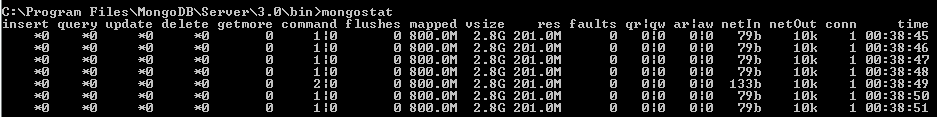
C:\Program Files\MongoDB\Server\3.0\bin > mongostat
|
It will create backup in C:\Program Files\MongoDB\Server\3.0\bin\dump\
Screenshot >
2) Understanding mongostat - What does Mongostat command do >
- Insert - Number of inserts operations per second.
- Query - Number of read operations per second..
- Query - Number of update operations per second..
- Delete -Number of delete operations per second..
- Getmore - number of cursor batch operations per second.
- Command - Number of commands operations per second..
- Flushes - On MMAPv1 Storage Engine - number of fsync operations per second.
You can also monitor data related to storage and memory >
- mapped - amount of data mapped (total data size) in megabytes
- vsize - virtual size of process in gigabytes
- res - resident size of process in megabytes
- fault - Number of page faults per second
You can also monitor information related to read and write operation (i.e. Disk Input/output (IO)) >
- qr - Length of the queue of clients waiting to read data from the MongoDB instance.
- qw - Length of the queue of clients waiting to write data from the MongoDB instance.
- ar - number of active clients performing read operations.
- aw - Number of active clients performing write operations.
You can also monitor information network related data >
- netIn - Network traffic received by MongoDB instance in bytes.
- netOut -Network traffic sent by MongoDB instance in bytes.
- conn - Total number of open connections
- time - It is current time
It is very helpful in monitoring and analyzing CPU and memory consumption in MongoDB.
3) For more highly detailed MongoDB statistics you may run db.serverStatus() >
Information you can get when you execute db.serverStatus() >
- "host" : "ankitMittal",
- "version" : "3.0.6",
- "process" : "mongod",
- "pid" (processId)
- "uptime" : 373579,
- "uptimeMillis" (MongoDB uptime in milliseconds)
- "uptimeEstimate" : 133825,
- "localTime" : ISODate("2017-01-13T23:18:41.138Z"),
- "connections" - "current" : 1 and "available" : 999999,
- "extra_info" - "page_faults" : 154969
- Locks information >
- "globalLock"
- "locks" :
- Indexcounters
- "Metadata"
- "network"
- "opcounters"
- "storageEngine"- "mmapv1"
- "metrics"
4) Summary -
So in this mongoDB tutorial we learned how can we Monitor MongoDB statistics and understood mongostat command in detail.
For monitoring use mongostat command.
C:\Program Files\MongoDB\Server\3.0\bin > mongostat
For more highly detailed MongoDB statistics you may run db.serverStatus().
Having any doubt? or you liked the tutorial! Please comment in below section.
Please express your love by liking JavaMadeSoEasy.com (JMSE) on facebook, following on google+ or Twitter. You may join our fbGroup or linkedInGroup as well.
RELATED LINKS>
Labels:
MongoDB