You are here : Home / Core Java Tutorials / Series of JVM and Garbage Collection (GC) in java - Best explanations ever
Contents of page >
- What is purpose of using jhat ?
- 1) First Write java program - (which we will later analyze with jhat)>
- 2) Use jps to find the vmid (virtual machine id i.e. JVM id)
- 3) Now we will how to use jmap and jhat
- 3.1) Use jmap - to generate heap dump
- From java docs about jmap
- Full form of jmap>
- Location of jmap?
- Use following command to generate heap dump >
- 3.2) Use jhat - to analyze the heap dump
- From java docs about jhat
- Full form of jhat>
- Location of jhat?
- Now we will type jhat command to analyze the heap dump >
- 4) Opening server on specific port >
- 5) Once we go to http://localhost:7000/
- 6) See heap information - objects formed in our java program
What is purpose of using jhat ?
In this tutorial we will learn how to use jmap - to generate heap dump. And,
Use jhat - to analyze the heap dump
1) First Write java program - (which we will later analyze with jhat )>
package garbageCollection;
import java.util.ArrayList;
import java.util.List;
public class GarbageCollectionAnalysisExample{
public static void main(String[] args) {
List<String> l = new ArrayList<String>();
for (int i = 0; i < 100000000; i++) {
l = new ArrayList<String>(); //Memory leak
System.out.println(l);
}
System.out.println("Done");
}
}
|
Execute the above java program. And this program will take long time to complete (Because of for loop).
And while program is executing follow step 2 (i.e. before program execution completes - If we execute below steps after programs execution is over - output will be command not found).
2) Use jps to find the vmid (virtual machine id i.e. JVM id)
What is jps?
JPS is Java Virtual Machine Process Status Tool.
Location of jps?
jps is located in {javaHome\bin}
In my system jps is located in C:\Program Files\Java\jdk1.8.0_05\bin\jps.exe
Go to CMD and type below commands >
C:\>jps
18588 Jps
17252 GarbageCollectionAnalysisExample
16048
2084 Main
C:\>
|
17252 is the vmid which we need.
3) Now we will how to use jmap and jhat
3.1) Use jmap - to generate heap dump
From java docs about jmap
“jmap prints shared object memory maps or heap memory details of a given process or core file or a remote debug server”
Full form of jmap>
Jmap stands for Memory map.
Location of jmap?
jmap is located in {javaHome\bin}
In my system jps is located in C:\Program Files\Java\jdk1.8.0_05\bin\jmap.exe
Use following command to generate heap dump >
jmap -dump:file=E:\heapDump.jmap 17252
Where 17252 is the vmid (picked from above).
C:\>
C:\>jmap -dump:file=E:\heapDump.jmap 17252
Dumping heap to E:\heapDump.jmap ...
Heap dump file created
C:\>
|
Heap dump will be generated in E:\heapDump.jmap
3.2) Use jhat - to analyze the heap dump generated using jmap in above step.
From java docs about jhat
“The jhat command parses a Java heap dump file and starts a web server. The jhat command lets you to browse heap dumps with your favorite web browser. The jhat command supports pre designed queries such as show all instances of a known class MyClass, and Object Query Language (OQL). OQL is similar to SQL, except for querying heap dumps. Help on OQL is available from the OQL help page shown by the jhat command. With the default port, OQL help is available at http://localhost:7000/oqlhelp/”
Full form of jhat>
Jhat stands for Java Heap Analysis Tool.
Location of jhat?
jhat is located in {javaHome\bin}
In my system jps is located in C:\Program Files\Java\jdk1.8.0_05\bin\jhat.exe
Now we will type jhat command to analyze the heap dump >
jhat E:\heapDump.jmap
C:\>jhat E:\heapDump.jmap
Reading from E:\heapDump.jmap...
Dump file created Mon Nov 07 23:59:19 IST 2016
Snapshot read, resolving...
Resolving 241865 objects...
Chasing references, expect 48 dots................................................
Eliminating duplicate references................................................
Snapshot resolved.
Started HTTP server on port 7000
Server is ready.
|
By default, it will start http server on port 7000.
Then we will go to http://localhost:7000/
4) Opening server on specific port >
C:\>jhat -port 7001 E:\dump.jmap
|
Then it will start http server on port 7001. Then go to http://localhost:7001/
5) Once we go to http://localhost:7000/
We will see screen like this
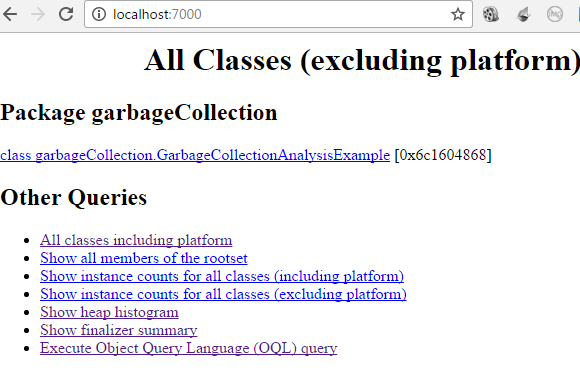
Here you will find information like -
Note : all these links are pointing to localhost, so they won’t work on your system until you start your server following the step 3.2.
6) See heap information - objects formed in our java program
Where we can find all the objects which were created in java program.

And the diagram clearly clearly shows that there were too many instance/objects of java.util.ArrayList and java.util.ArrayList$Itr class.
So, they are clearly creating the memory leak (As per program we have used in section 1 of this tutorial). So, you can according fix your code.
Summary -
So in this core java tutorial we learned how to use JHAT to analyze and monitor the heat dump - Using jmap as well in java.
Having any doubt? or you liked the tutorial! Please comment in below section.
Please express your love by liking JavaMadeSoEasy.com (JMSE) on facebook, following on google+ or Twitter.
RELATED LINKS>
Most important and frequently used VM (JVM) PARAMETERS with examples in JVM Heap memory in java
Different type of garbage collectors in java>
>Serial collector / Serial GC (Garbage collector) in java
>Throughput GC (Garbage collector) or Parallel collector in java
>Concurrent Mark Sweep (CMS) collector / concurrent low pause garbage collector in java
>G1 garbage collector / Garbage first collector in java
JVM in detail - Garbage collection & heap structure >
>JVM Heap memory (Hotspot heap structure) with diagram in java
>What are Minor, Major and Full garbage collection in JVM in java
Important VM parameters >
>What are -XX:PermSize and -XX:MaxPermSize JVM parameters with examples in java | Differences
>Solve java.lang.OutOfMemoryError : unable to create new native Thread - Xss JVM option
More VM parameters >
>How to use -verbose:gc VM argument
>-Xverify option in java
Monitor, analyze garbage collection and fix MEMORY LEAK >
>How to monitor and analyze the garbage collection in 10 ways in java
>Detecting and fixing memory leak in java
Pass VM para through CMD, eclipse to java program and to Apache tomcat >
>How to write java program to pass VM/JVM parameters through CMD
>How to pass vmArgs(JVM parameters) to java program in eclipse
>How to pass VM argument to tomcat in eclipse
Few more garbage collection and JVM related tutorials>
What is Java Native Interface(JNI)
Find which garbage collector you are using through cmd and java program
Labels:
Core Java
Garbage collection in java